





 Overview
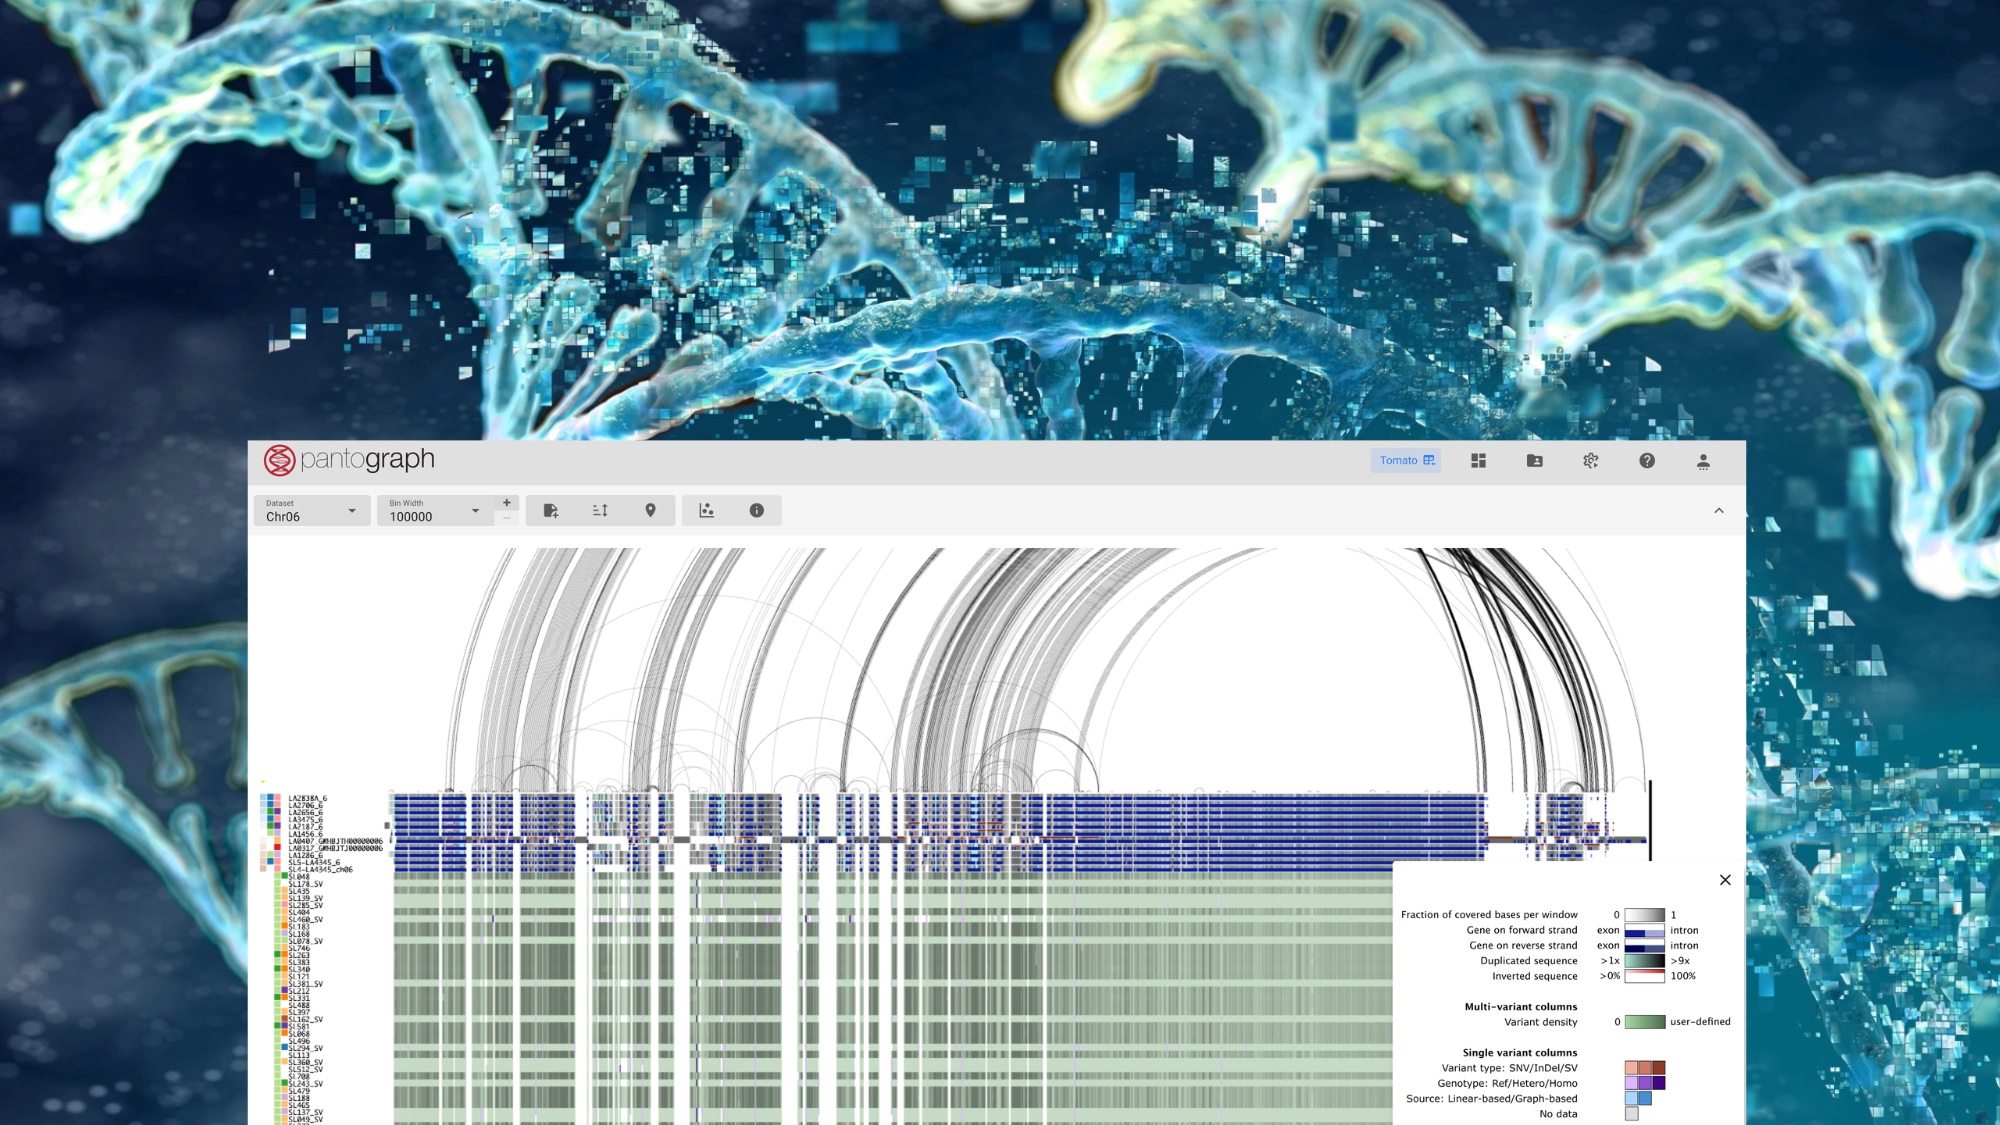
In our new live demo series, we take you inside Pantograph - step by step. Each short snippet focuses on one part of the platform and the genomic challenges it helps solve.
A single reference genome can only show part of the picture. Pantograph, Computomics’ interactive omics data hub, brings multiple genome assemblies into one shared reference space. It turns fragmented genomic data into a shared, collaborative resource. Teams can pinpoint causal genes, uncover novel markers, and identify promising gene-editing targets, no advanced coding required.
In the Pantograph workspace, genome assemblies, gene annotations, genotypes, phenotypes, and multi-omics data come together. Breeders and bioinformaticians can browse structural variants, genes, and genetic variation the way you'd explore a map - zooming from a whole genome down to a single base pair, with every layer of biology visible at once. From single nucleotide differences to large insertions, deletions, and inversions, nothing gets lost in translation.
In this video series, we're showing Pantograph in action. Each demo walks through a real use case - from exploring pangenome structure to linking genetic variation with traits. This way you can see exactly how it fits into a breeding or research workflow. Ready to explore the genome landscape with us?
🌱 Part 1: Pangenomes – An Introduction
We start with the foundation: why pangenomes matter. Instead of relying on a single linear reference genome, pangenomes combine multiple whole-genome assemblies. This creates a much broader view of genetic diversity and helps uncover variation that would otherwise remain hidden.
🌱 Part 2: Pangenomes – When Pangenomes Become Handy
We look at just how much genetic diversity can be missed when relying on a single reference genome. Pangenomes capture additional sequences, genes and structural variants that are not represented in the reference. This opens the door to understanding genetic variation that SNPs and traditional markers alone cannot explain.
🌱 Part 3: Pangenomes - What is Pantograph?
We move from the pangenome itself to what you can do with it in Pantograph.
Pantograph uses the pangenome graph as a genomic backbone. You can enrich it with variants, phenotypes, expression data and other omics data, and explore everything together in one shared coordinate space. Pantograph helps connect genomic variation with traits, identify gene editing targets and take analyses beyond SNPs.
Stay tuned for more short demos on Pantograph and the genomic challenges it tackles!
More information
 |
 |
|
Dr. Christian Kubica |
Dr. Jörg Hagmann |
Contact Chris or Jörg for questions or to schedule a personal live demo.
More about Pantograph on the Pantograph website.
Share on

